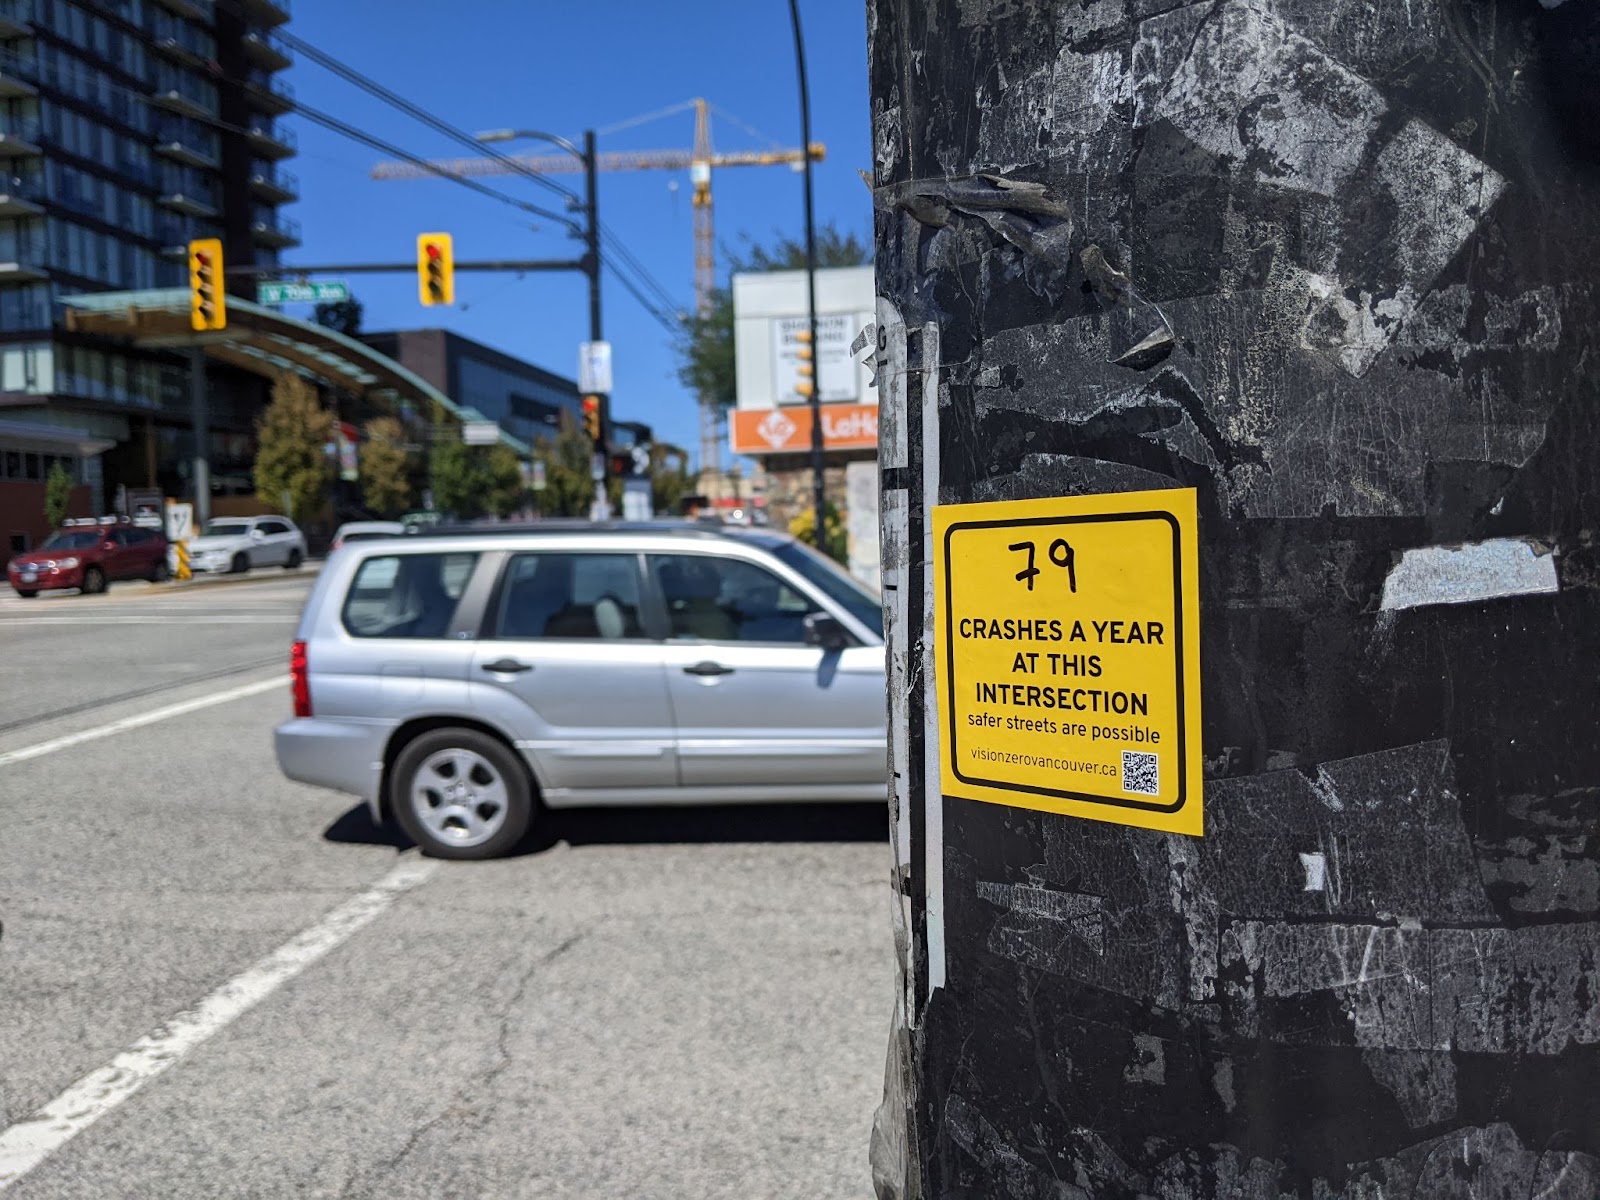
A crash sticker at Granville & 70th, where there are an average of 79 crashes per year.
If you’ve been walking around the Lower Mainland over the past couple years, chances are you’ve seen one of our yellow “crash number” stickers on a telephone pole. Have you wondered where we get the numbers?
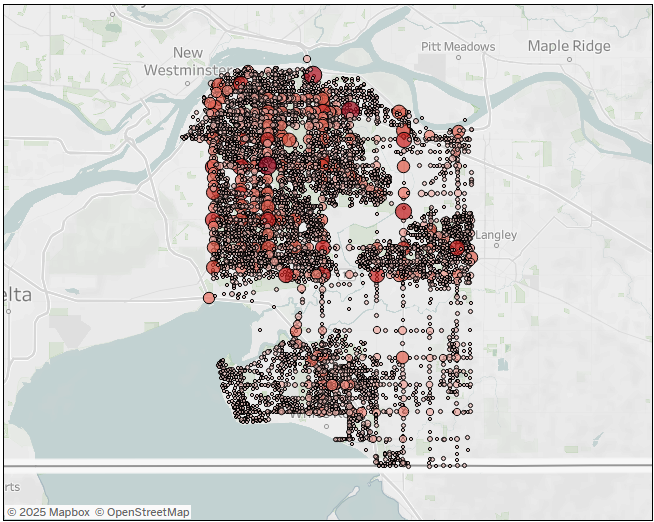
ICBC has a really good statistics page that publishes annual data. They give numbers on total crashes, crashes involving injury, primary causes of collisions, and crashes involving cyclists or pedestrians. And, they provide maps. Here’s a map of all crashes in Vancouver from 2019-2024.
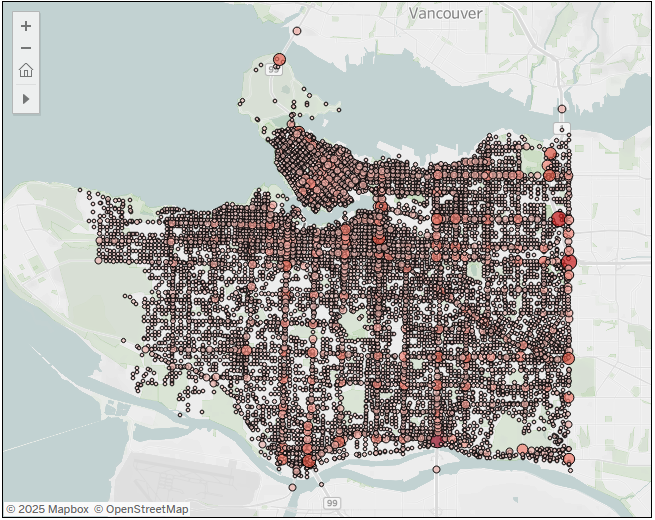
The size of each circle is proportional to the number of crashes at that intersection. The largest of the circles – at the Knight Street Bridge on-ramp – is 1,480. There are 114,752 crashes on this map over 5 years. That’s almost 23,000 per year, or 63 per day – and that’s just the City of Vancouver alone.
These numbers can be jarring. People often think that car crashes are an infrequent occurrence, a rare culmination of bad decisions and bad luck that is unlikely to happen to them. The statistics tell a different picture. Crashes are extremely common, and they happen everywhere.
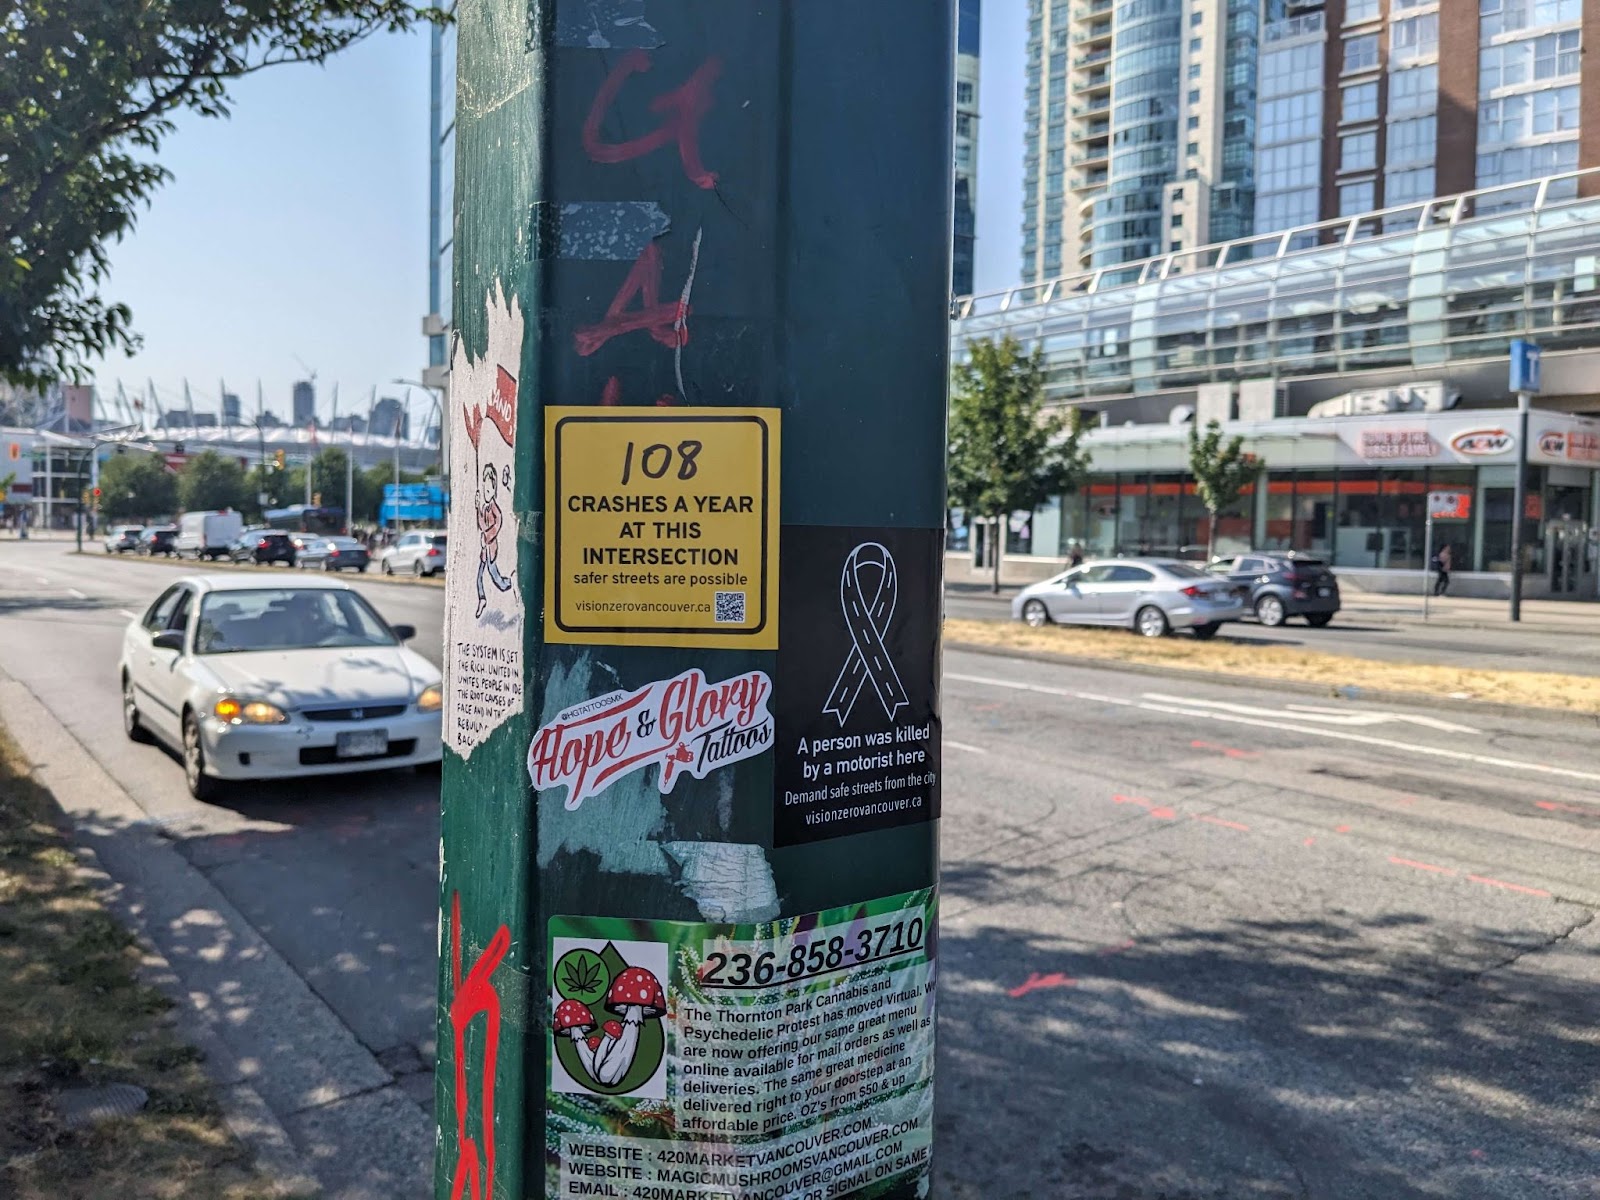
A crash sticker at Main and Terminal, showing an average of 108 crashes per year.
When we put up these stickers at intersections, we take the ICBC numbers for that intersection over the past 5 years and divide by 5, to get an average number of crashes per year at that spot. (Note that the data are updated every year, so any discrepancy between a number you see on a sticker and the ICBC webpage is probably due to a recent update.)
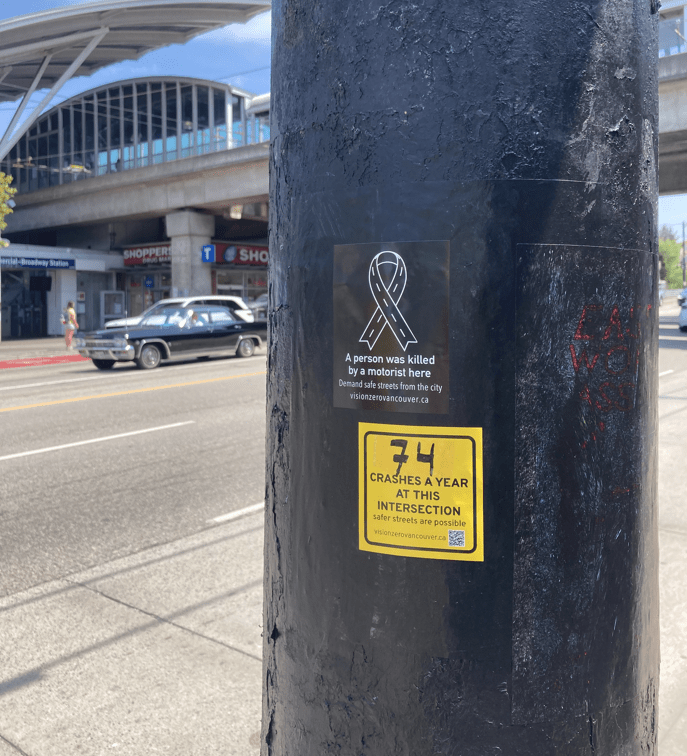
A crash sticker at Broadway and Commercial, with 74 crashes per year, including a recent fatal crash.
There are a staggering 67 intersections in Vancouver alone where there’s an average of at least 1 crash per week, and over a hundred others throughout the Lower Mainland; Surrey for example has 71 such intersections. In any given year, approximately 100 crashes around the Lower Mainland are fatal, and thousands more result in life-altering injury.
Five years of crash data in Surrey. The largest circle, at 88th Ave & King George Blvd, represents 896 crashes.
So why do we put up these stickers? The point we aim to convey is that crashes aren’t rare. They aren’t flukes or acts of God. They’re not caused by a small handful of bad drivers. They are extremely prevalent, they happen by the dozens at almost every intersection in the city, and they’re the result of a systemic problem: our roads are designed for rapid vehicle throughput first, and human life second. We hope that once that message sinks in, people will be more inspired to act.
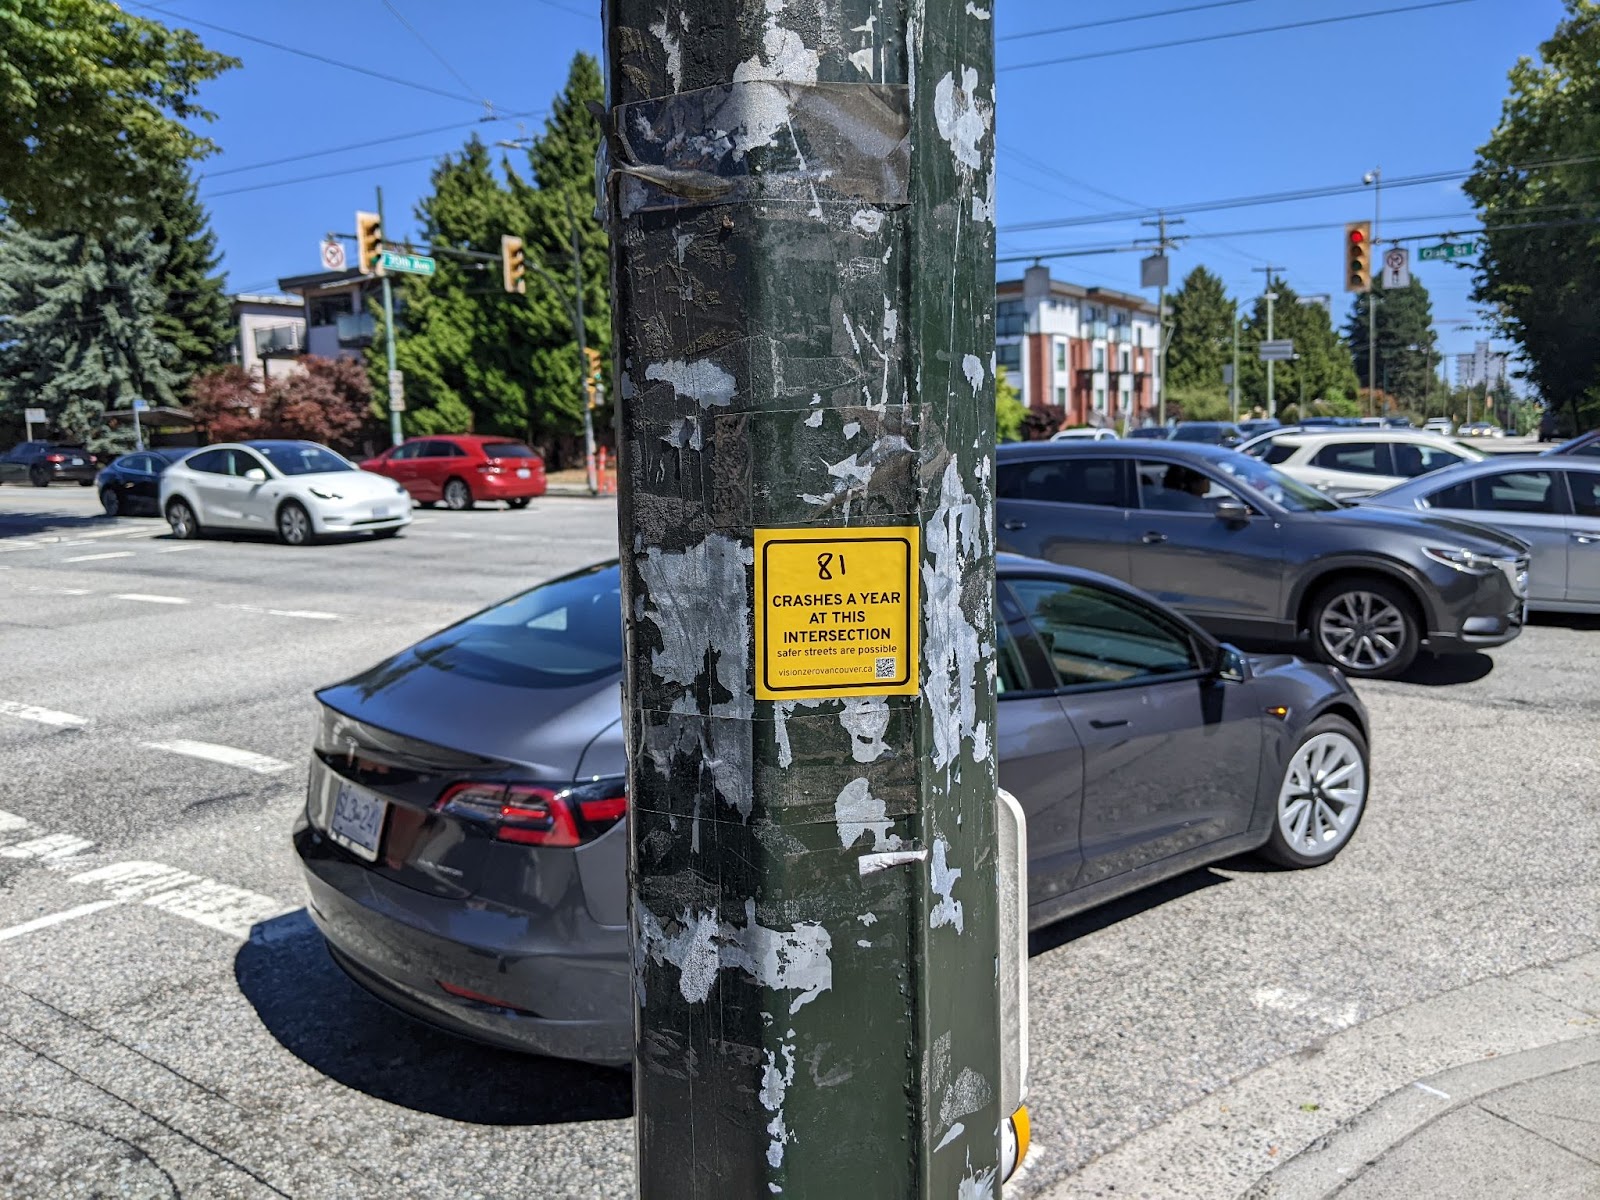
Oak and 70th sees an average of 81 crashes per year.
Do you want to get your hands on some stickers and help put them up to raise awareness in your area? We sell them at cost: 25 cents each (20 stickers for $5). We’re just a small team of volunteers, so if you want to help out with this please reach out! Send us an email at contact@visionzerovancouver.ca
Here’s to a future with fewer stickers and safer roads.
